Static Fields: Fall-2025
HW 03: Due W2 D3
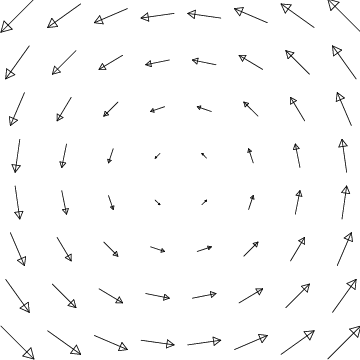
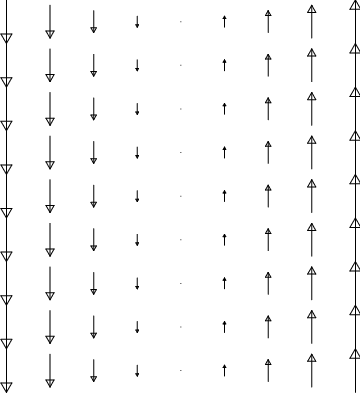
- Vector Sketch (Curvilinear Coordinates)
Sketch each of the vector fields below by hand. You can check your answers using technology. Make sure that you show enough arrows to show the key features of the graph.
- \(\boldsymbol{\vec K}=s\,\boldsymbol{\hat s}\)
- \(\boldsymbol{\vec M}=\sin\phi\,\boldsymbol{\hat s}\)
- \(\boldsymbol{\vec N}=\sin(2\pi s)\,\boldsymbol{\hat\phi}\)
- Circulation I
The circulation of a vector field \(\boldsymbol{\vec F}\) around a closed curve \(C\) is given by \[\oint_C\boldsymbol{\vec F}\cdot d\boldsymbol{\vec r}\]
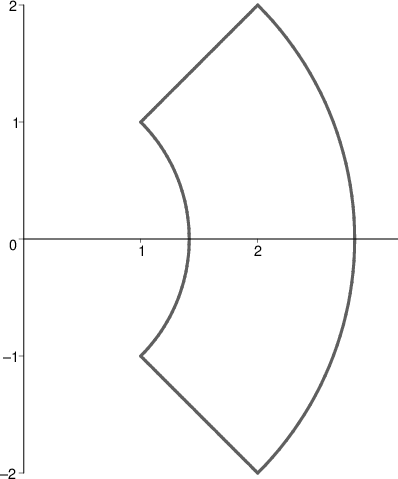
For each of the vector fields below, explain whether you expect the given vector field to have positive, negative, or zero circulation counterclockwise around the closed curve \(C\) in the figure shown above. Two of the segments of \(C\) are circular arcs centered at the origin; the other two are radial line segments. \begin{align*} \hbox{I.}~~\boldsymbol{\vec G} &= x\,\boldsymbol{\hat x} + y\,\boldsymbol{\hat y} \\ \hbox{II.}~\boldsymbol{\vec H} &= y\,\boldsymbol{\hat x} - x\,\boldsymbol{\hat y} \end{align*}
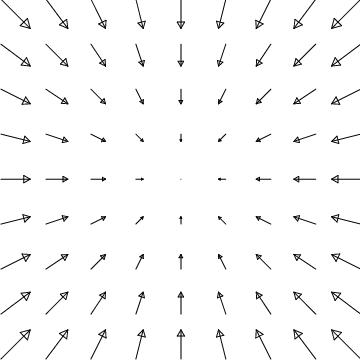
- Vector Line Integrals
- For each vector field \(\boldsymbol{\vec F}\) shown, sketch a curve for which the integral \(\displaystyle\int_C\boldsymbol{\vec F}\cdot d\boldsymbol{\vec r}\) is positive.
- For which of these vector fields is it possible to choose your curve to be closed?
-
- Contours
Shown below is a contour plot of a scalar field, \(\mu(x,y)\). Assume that \(x\) and \(y\) are measured in meters and that \(\mu\) is measured in kilograms. Four points are indicated on the plot.

- Determine \(\frac{\partial\mu}{\partial x}\) and \(\frac{\partial\mu}{\partial y}\) at each of the four points.
- On a printout of the figure, draw a qualitatively accurate vector at each point corresponding to the gradient of \(\mu(x,y)\) using your answers to part a above. How did you choose a scale for your vectors? Describe how the direction of the gradient vector is related to the contours on the plot and what property of the contour map is related to the magnitude of the gradient vector.
- Evaluate the gradient of \(h(x,y)=(x+1)^2\left(\frac{x}{2}-\frac{y}{3}\right)^3\) at the point \((x,y)=(3,-2)\).