Oscillations and Waves: Winter-2026
HW 3b: Due W3 D5
- LRC Behavior At, Above, and Below Resonance
You should find the Mathlet at https://mathlets.org/mathlets/series-rlc-circuit useful. In fact, the purpose of this question is really to get you to explain that simulation confidently.
A series LRC circuit is driven by a sinusoidal voltage that by convention we write: \[|V_0|\cos{(\omega t)=Re[|V_0|e^{i\omega t}]}\]
Draw phasor diagrams (i.e. on an Argand plot) representing the driving voltage at \(t=0\) and each of the voltages across teh capacitor \(V_C\), resistor \(V_R\), inductor \(V_L\) in a driven \(LRC\) circuit for three different cases: \((1) \,\omega << \omega_0\), \((2)\,\omega=\omega_0\) (resonance frequency), \((3)\,\omega>>\omega_0\). One phasor is filled in for you, with the red arrow representing the phase of the input voltage into the circuit and the blue arrow representing the phase of the voltage across the circuit component. Don't worry too much about the magnitudes of each arrow.
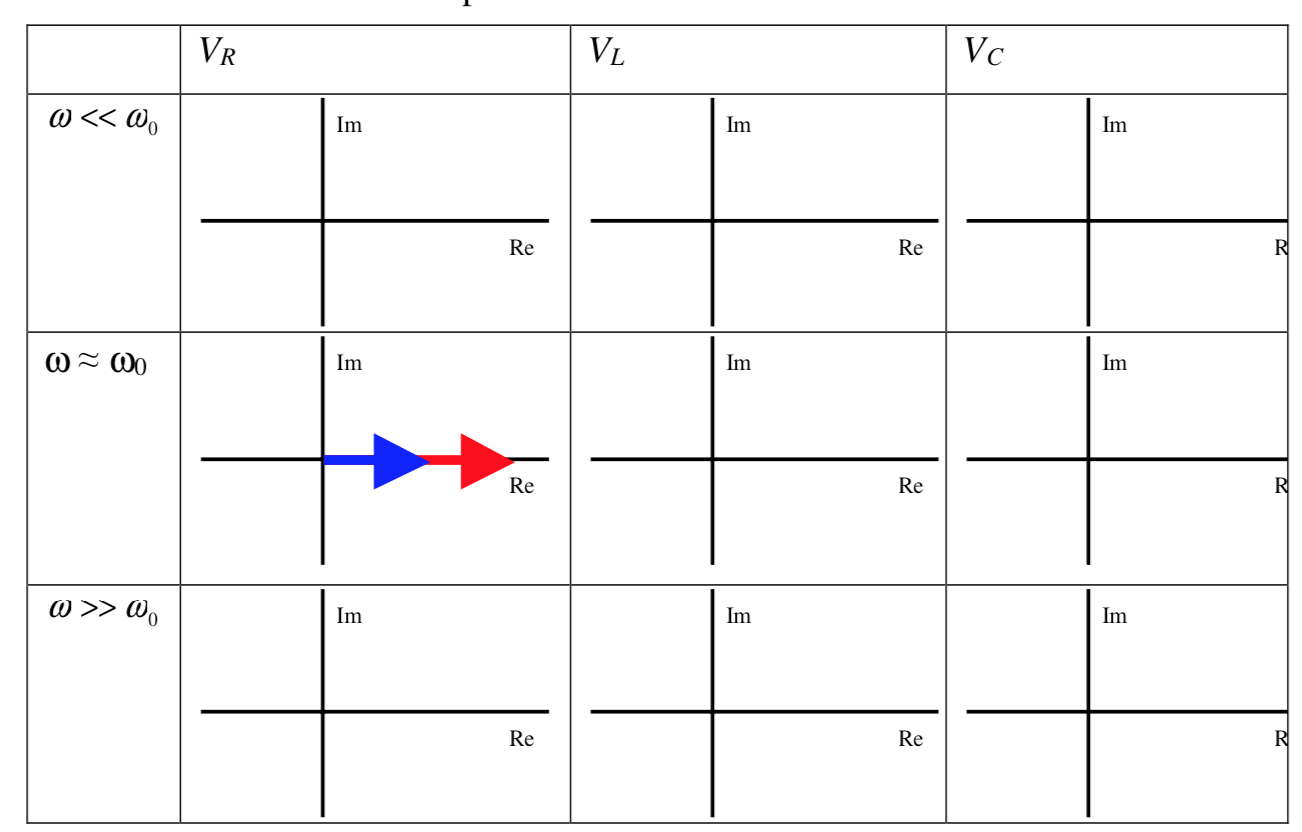
- Can you explain why we say the circuit is predominantly resistive at resonance, predominantly capacitative at low frequencies, and predominately inductive at high frequencies?
- Broadcast Bandwidth FM radio stations have broadcast frequencies of approximately \(100\,MHz\). Assume that your radio uses a series LRC circuit similar to the one you used in the lab as part of the receiver electronics. The quality factor \(Q\) of the receiver circuit determines the spacing of the broadcast frequencies of the stations your receiver pick up without interference from other stations. Estimate the spacing of the broadcast frequencies of FM stations if typical receivers have a \(Q\) of \(500\) or better. Explain your reasoning, and include a graph to illustrate (sketch is OK).