Interpreting Hydrogen Atom Plots
-
Central Forces 2021
Included are three figures of probability density, one each of a spherical harmonic, a radial function, and a hydrogen atom state. Write a few paragraphs about how the plots for the angular \(|Y_2^1(\theta,\phi)|^2\) and radial \(|R_{4,2}(r)|^2\) densities would combine to produce the full Hydrogen state \(|\Psi_{4,2,1}(r,\theta,\phi)|^2\). In particular, describe how the angular and radial features appear in the final plot and how features of the functional version are expressed in all plots. Your discussion should be thorough enough that if you only had two of the plots, you would be able to describe what the third would look like.
The code for these plots is called cfhydrogenvis.nb. You are encouraged to investigate it and look at other \(n,\ell, m\) combinations.
Spherical Harmonic: \(|Y_2^1(\theta,\phi)|^2\)
The plot above is a spherical color map for \(|Y_2^1(\theta,\phi)|^2\). The colors range from Blue when the function is equal to zero, to Red when the function has maximum value. Radial Function: \(|R_{4,2}(r)|^2\)
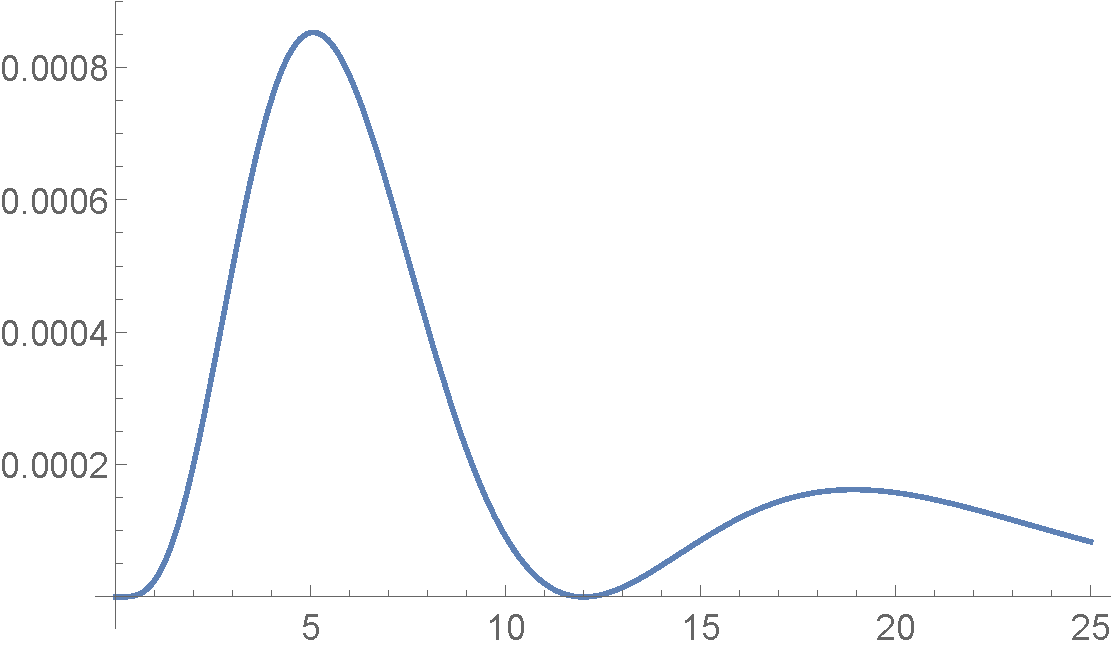
This is a plot of \(|R_{4,2}(r)|^2\). The horizontal axis is plotted in units of the Bohr Radius, \(a_o\). Hydrogen Atom: \(|\Psi_{4,2,1}(r,\theta,\phi)|^2\)
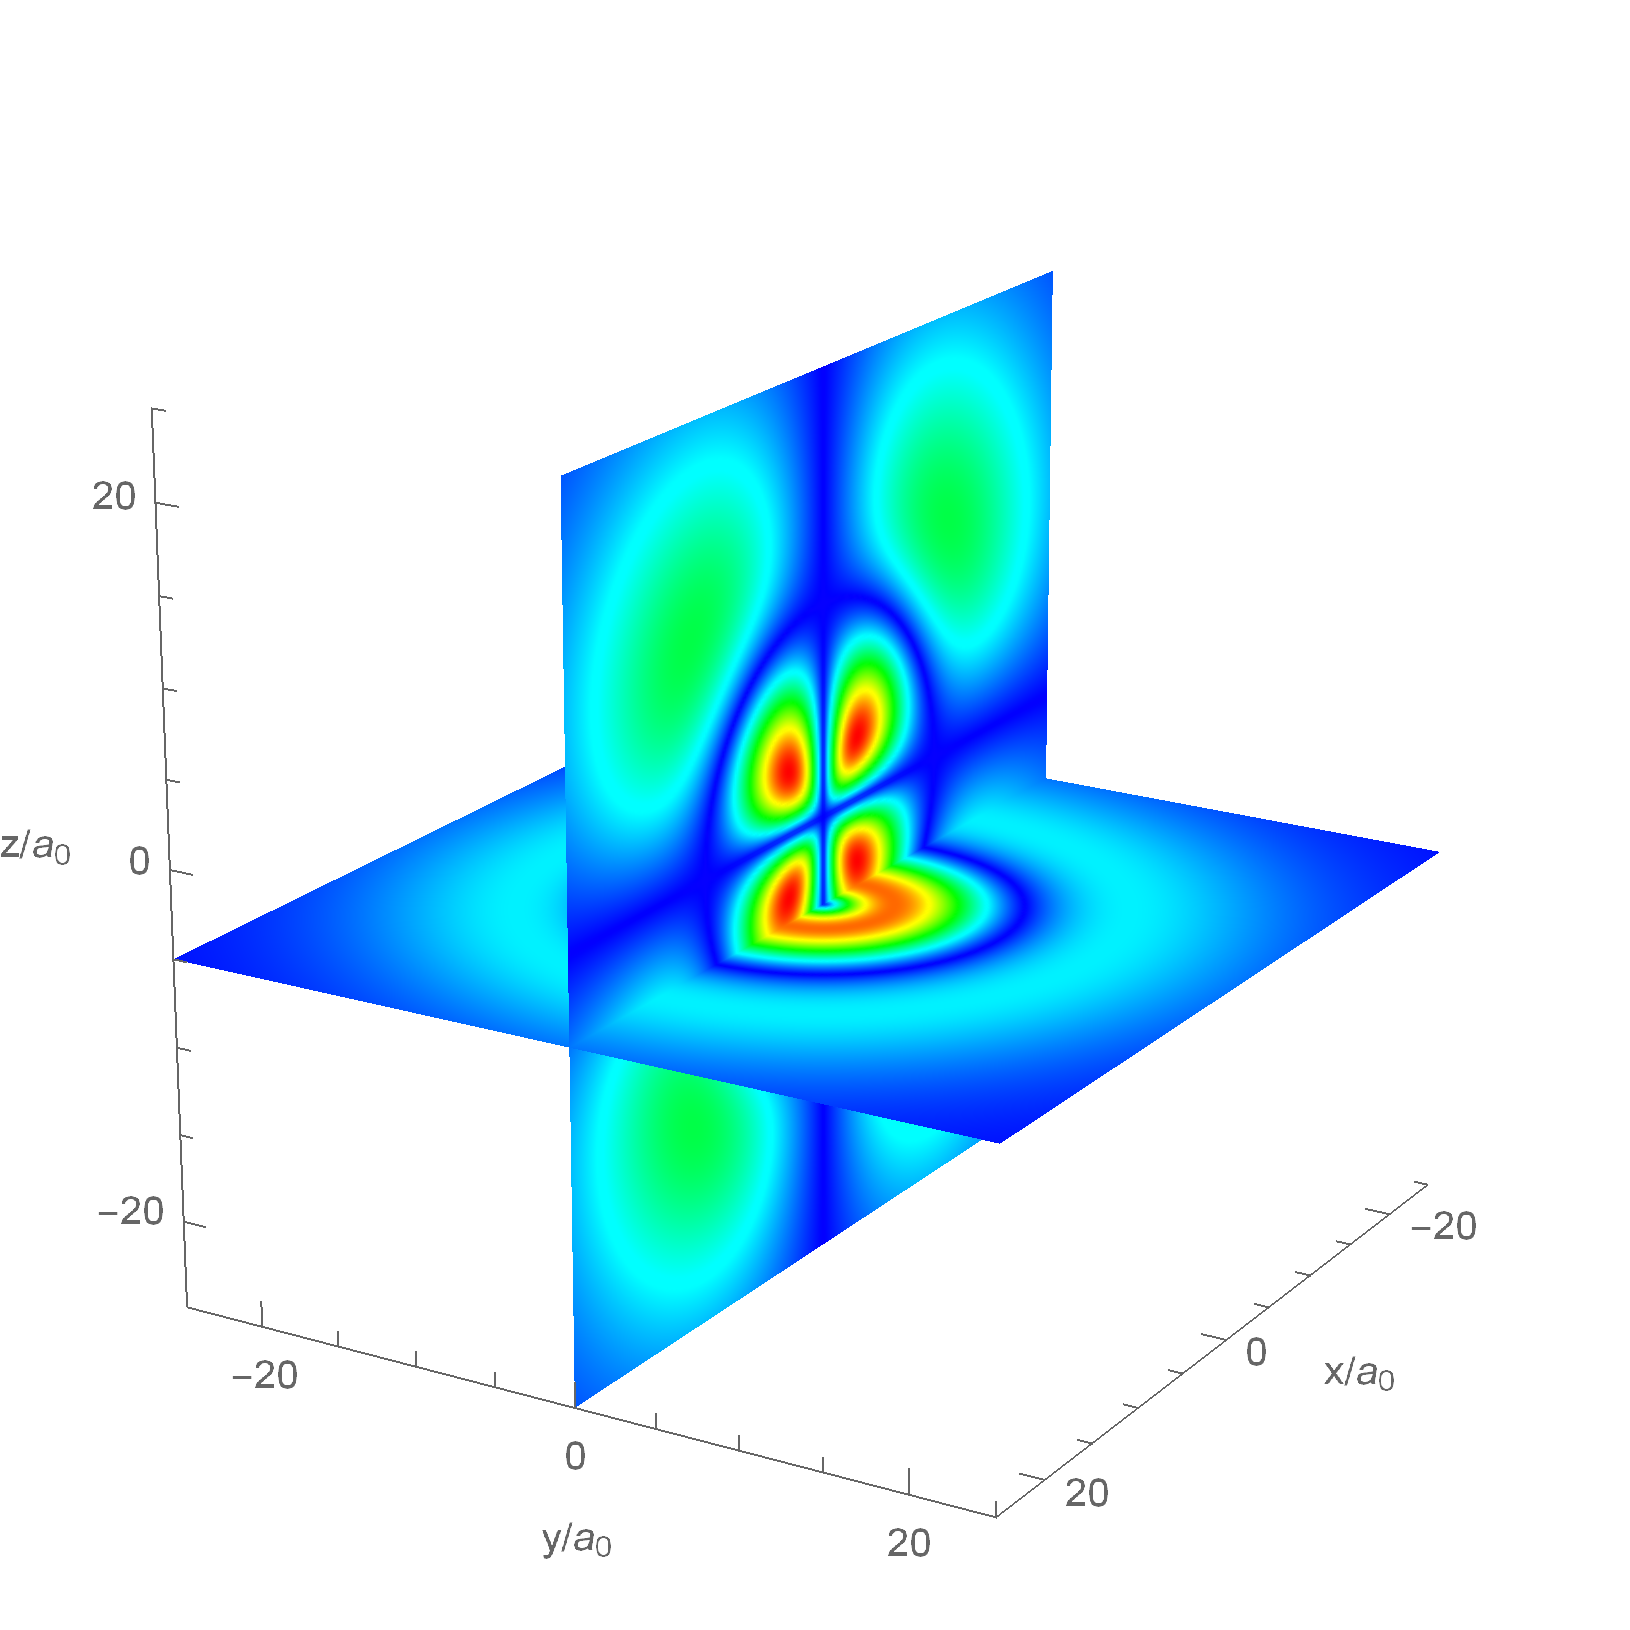
This plot contains two cross-section color plots of the probability density for a possible state of the Hydrogen atom, \(|\Psi_{4,2,1}(r,\theta,\phi)|^2\). The spatial position axes are plotted in units of the Bohr Radius and the color map ranges from \(Blue=min\) to \(Red=max\).